Presentations - Graphics - Roadmap
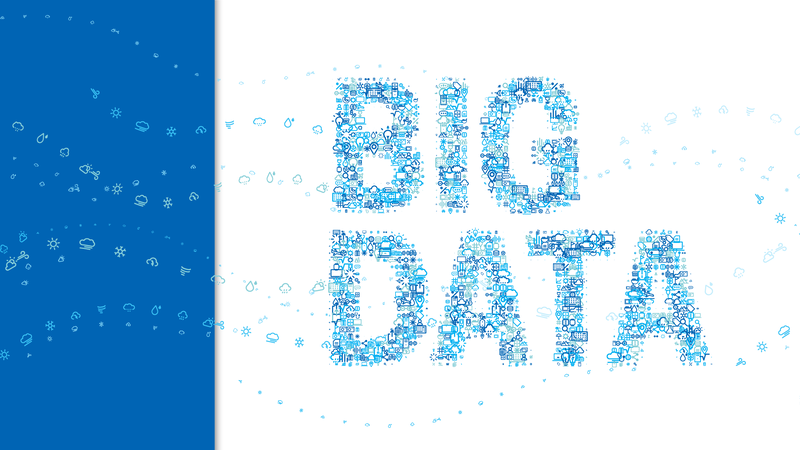
DATA VISUALIZATION
DATA VISUALIZATION
Overview
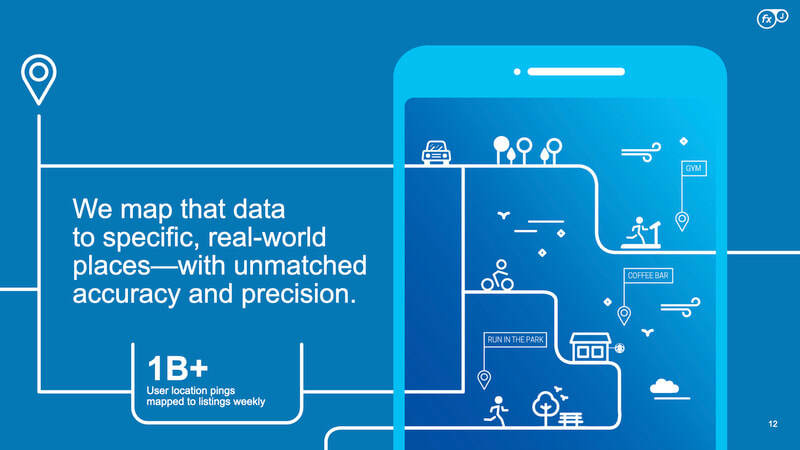
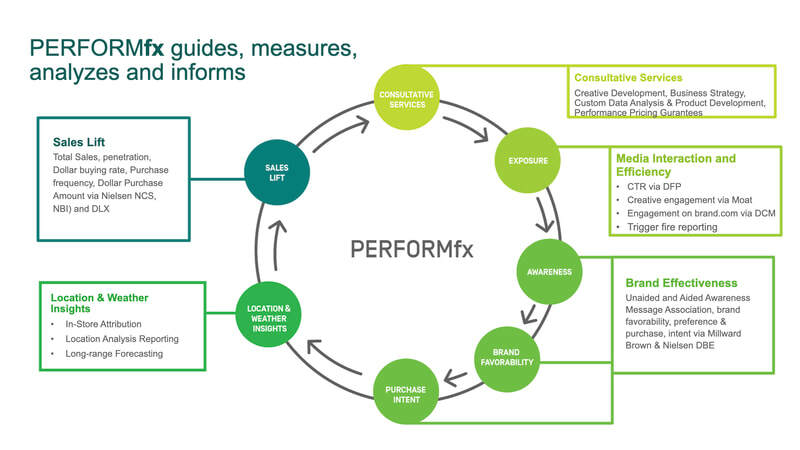
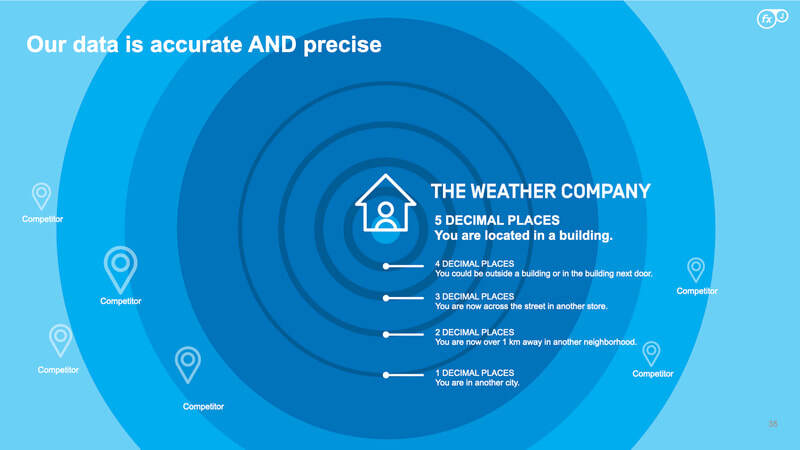
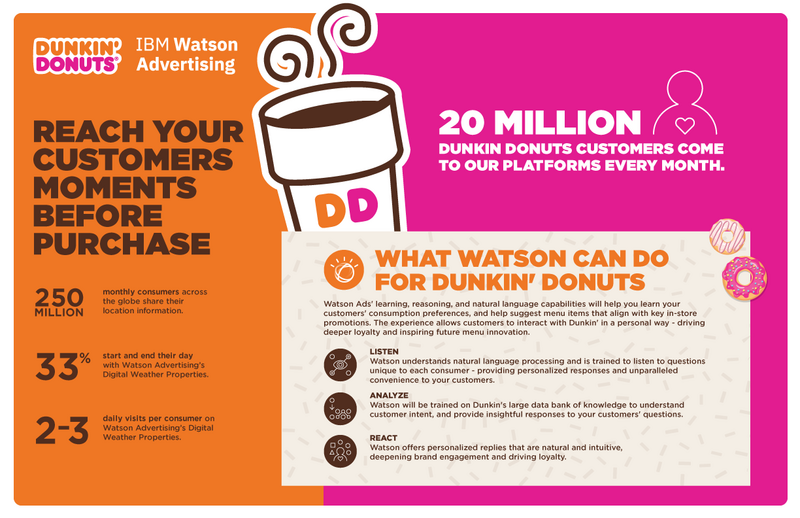
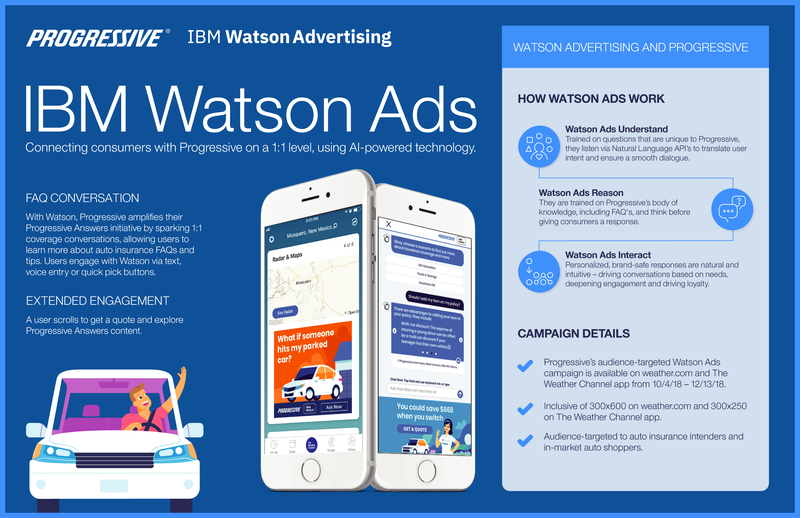
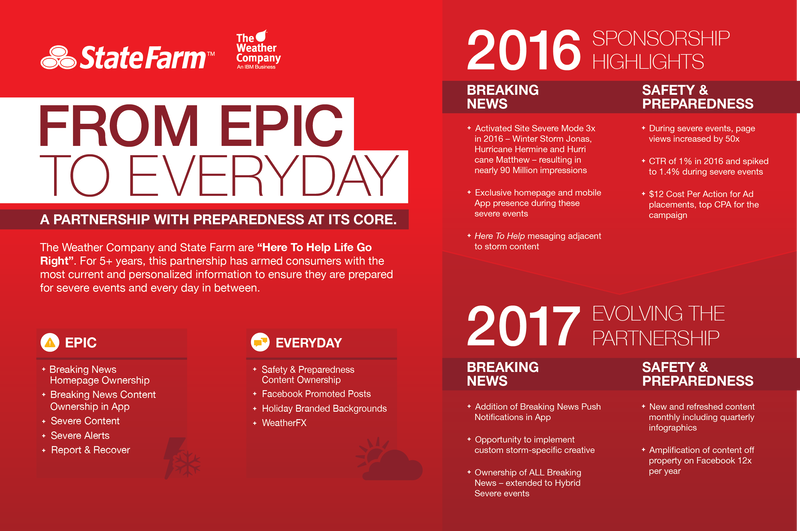
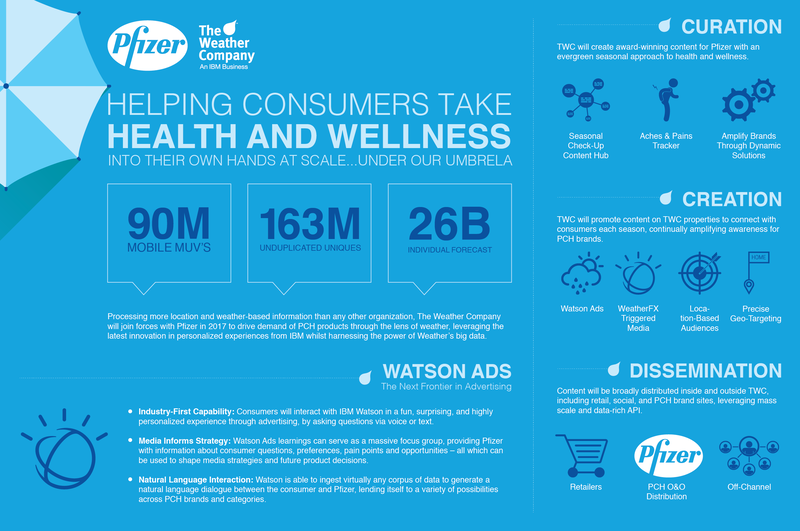
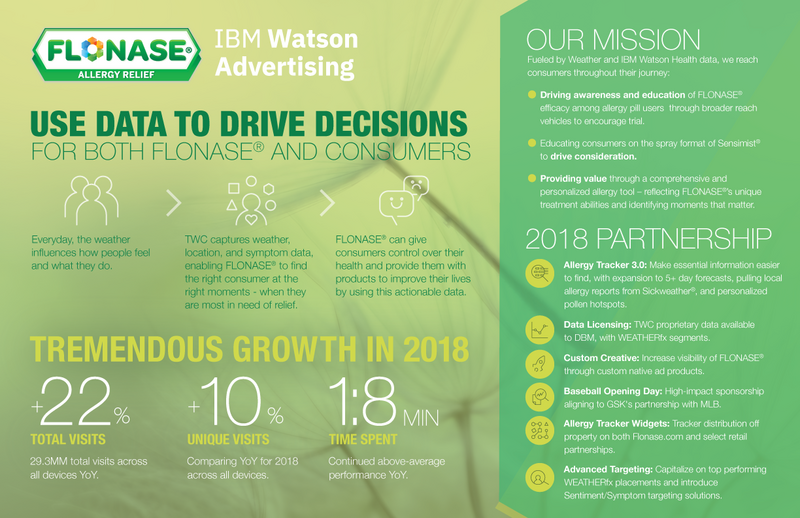
I had the opportunity to work closely with high-level executives to help them craft the brand storytelling and to translate complex data using visual elements like charts, graphs, and maps.
Providing clients and employees an accessible way to see and understand trends, outliers, and patterns. Analyzing massive amounts of data and information to make data-driven decisions helping to tell a story, removing the noise from data and highlighting the useful information. Bellow you will find some examples of my work.
Providing clients and employees an accessible way to see and understand trends, outliers, and patterns. Analyzing massive amounts of data and information to make data-driven decisions helping to tell a story, removing the noise from data and highlighting the useful information. Bellow you will find some examples of my work.
MY ROLES
Art Direction, Visual Design, Data Visualization
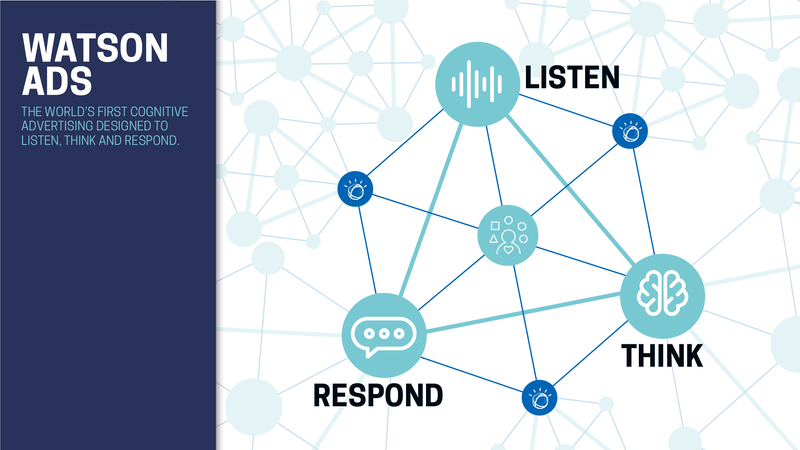
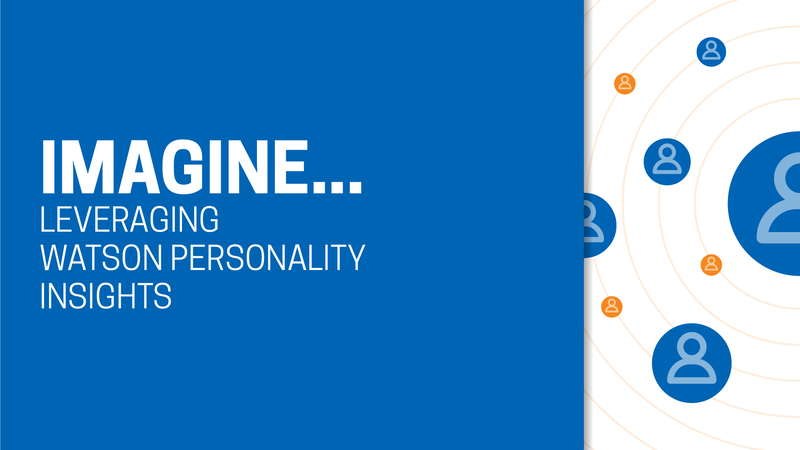
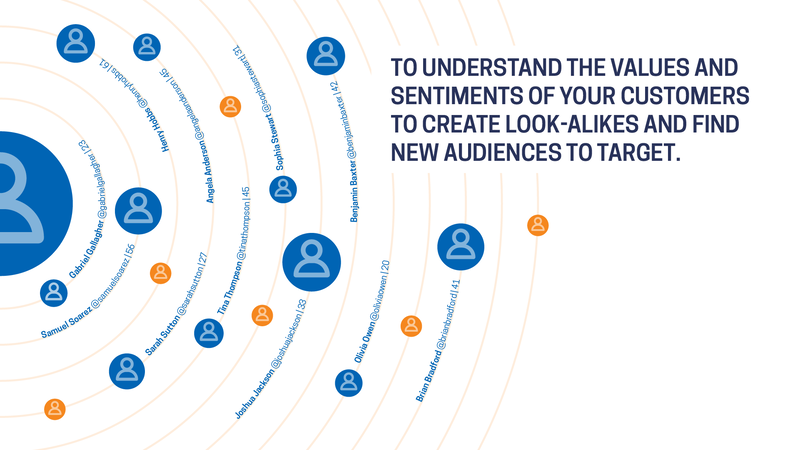
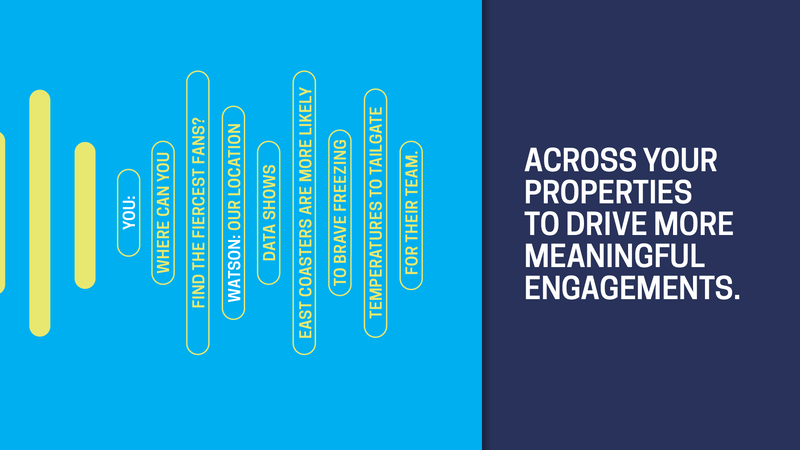
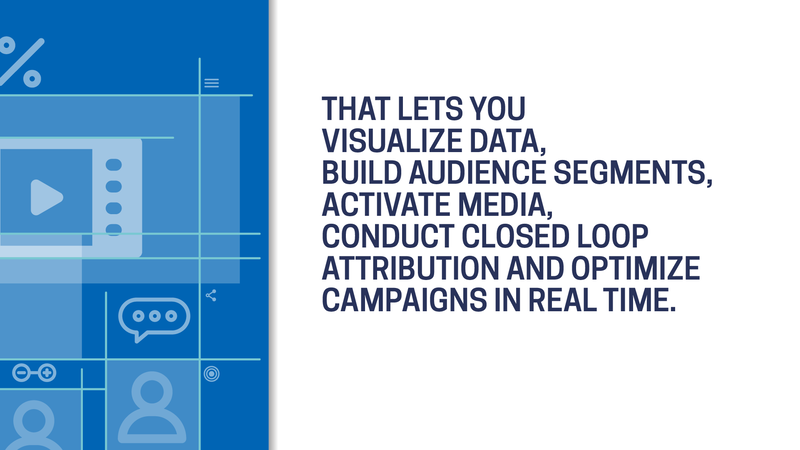
The Weather Company Introduces Watson Ads
Presentation - CES - 2017

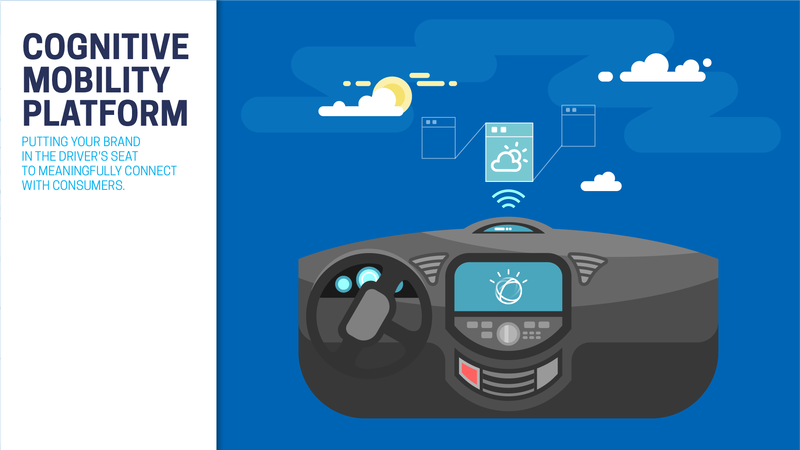
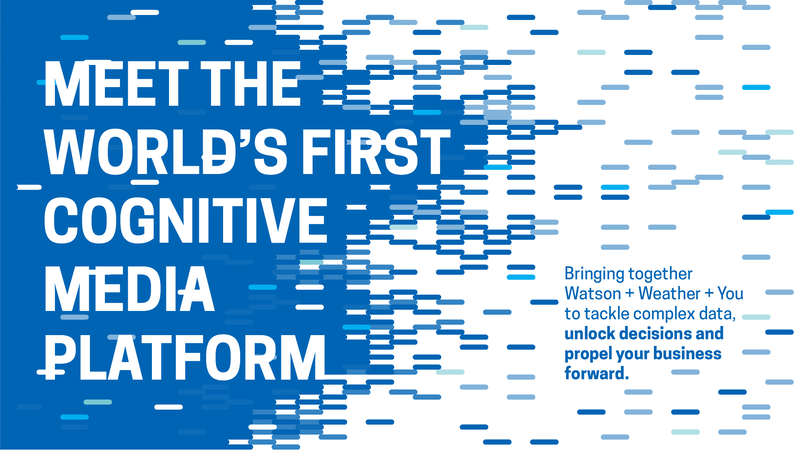


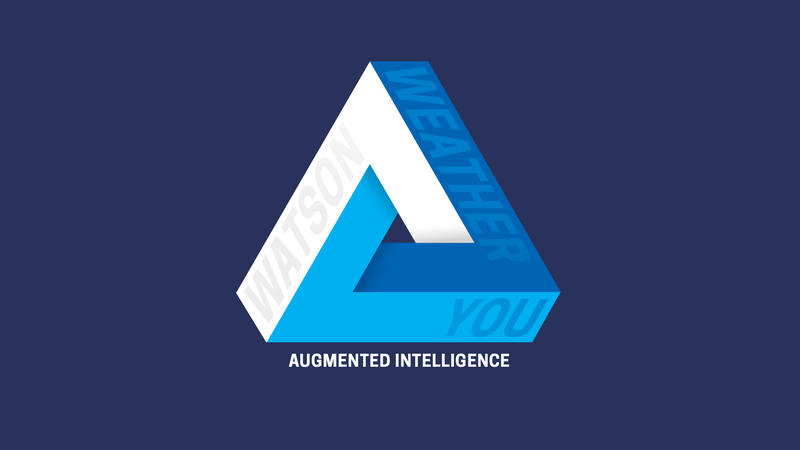


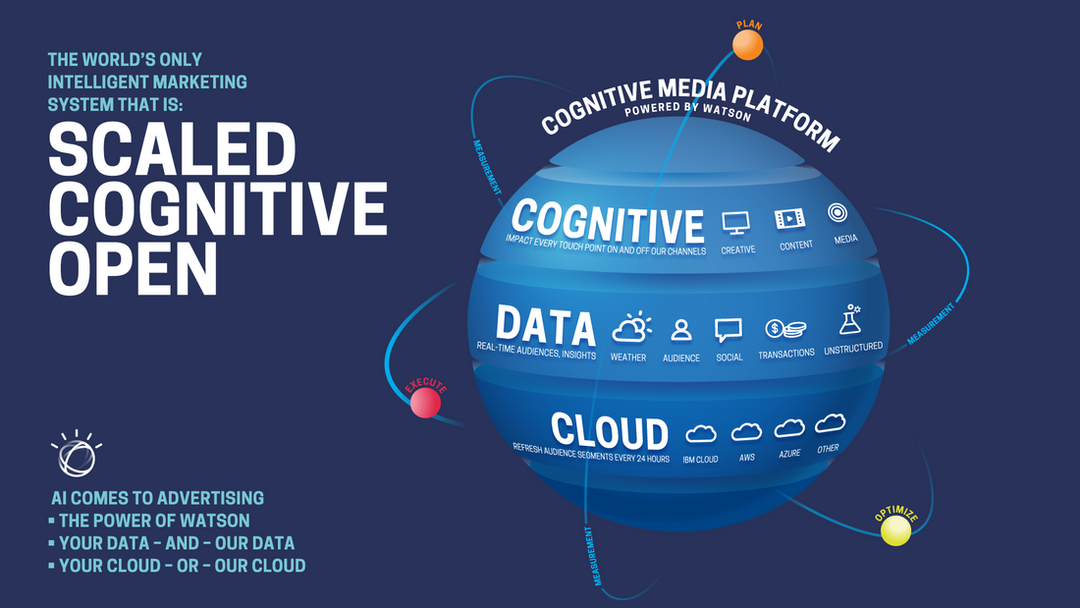
Cognitive Media Platform
Infographic - CES - 2017
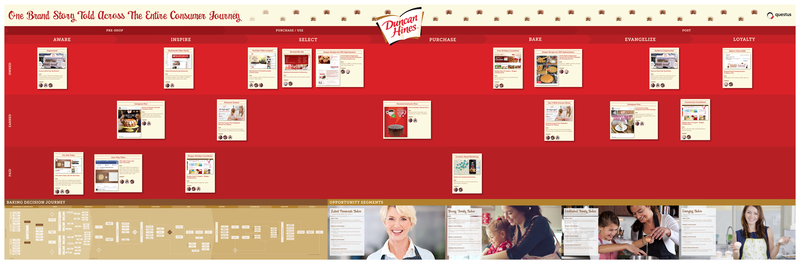
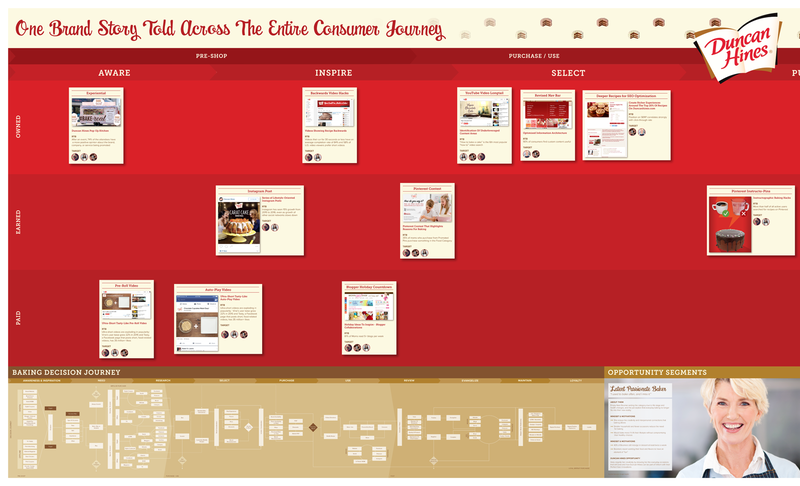
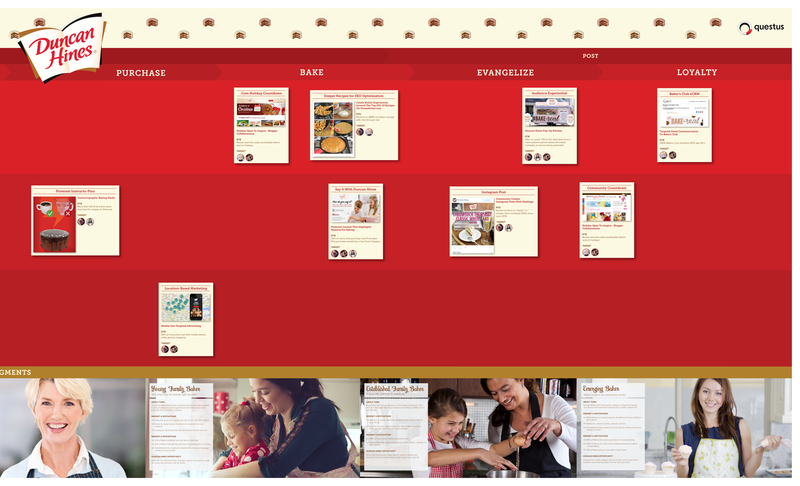
Duncan Hines Consumer Journey
Roadmap - Internal Use - 2016
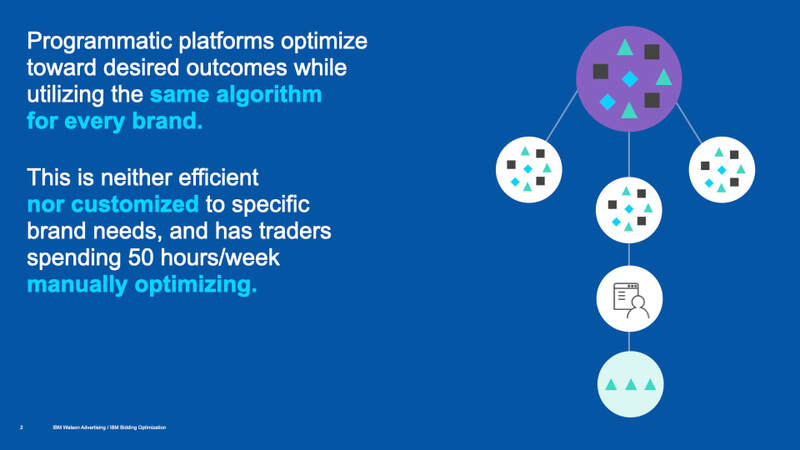
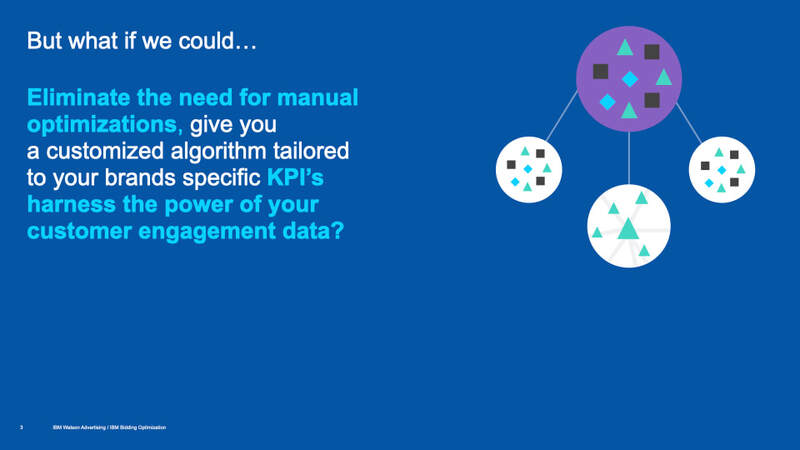
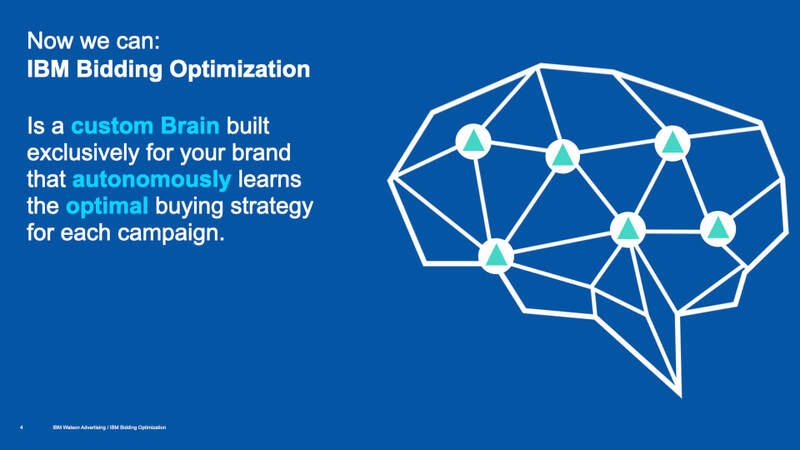
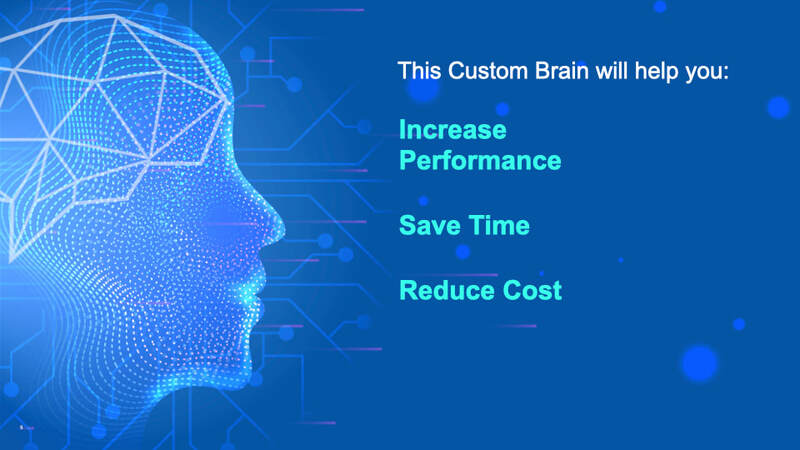
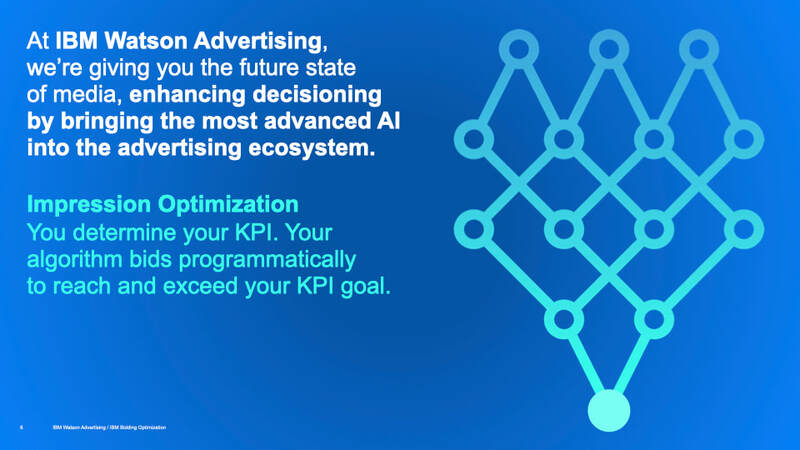
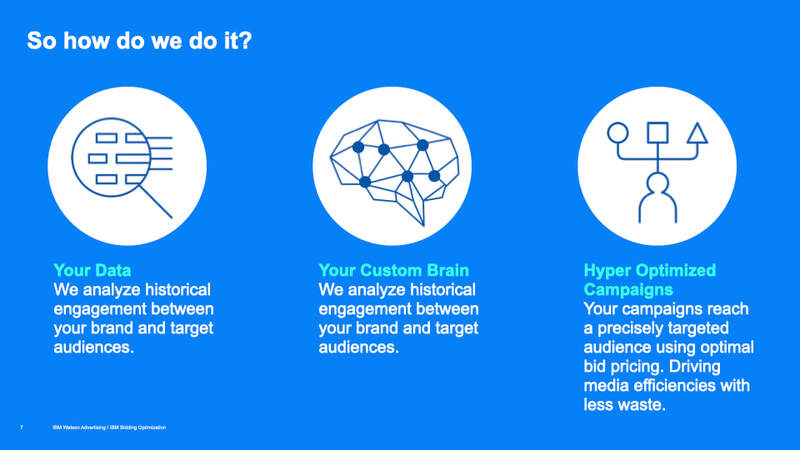
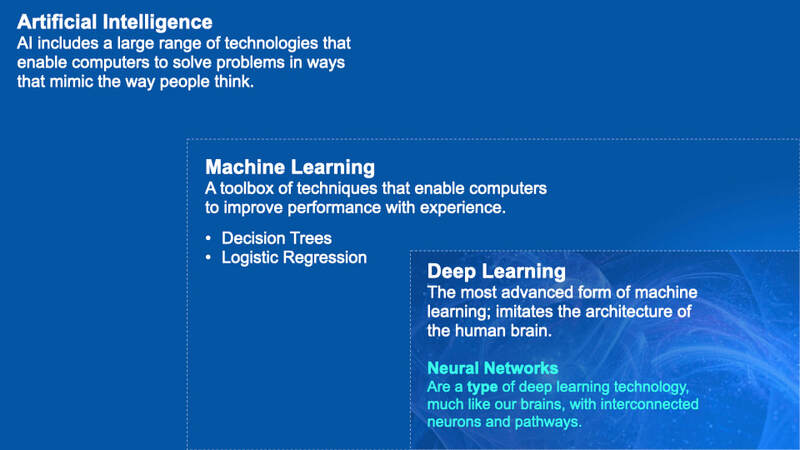
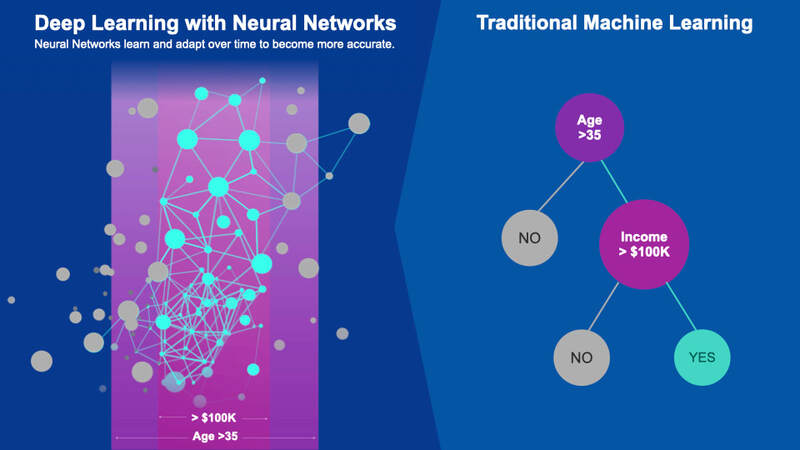
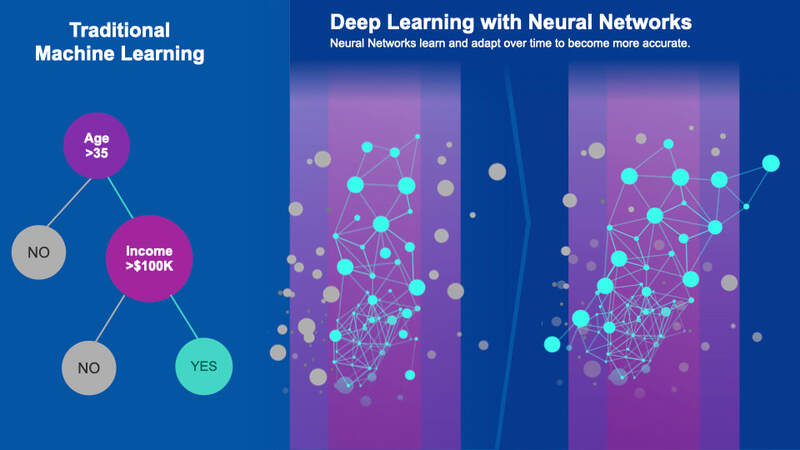
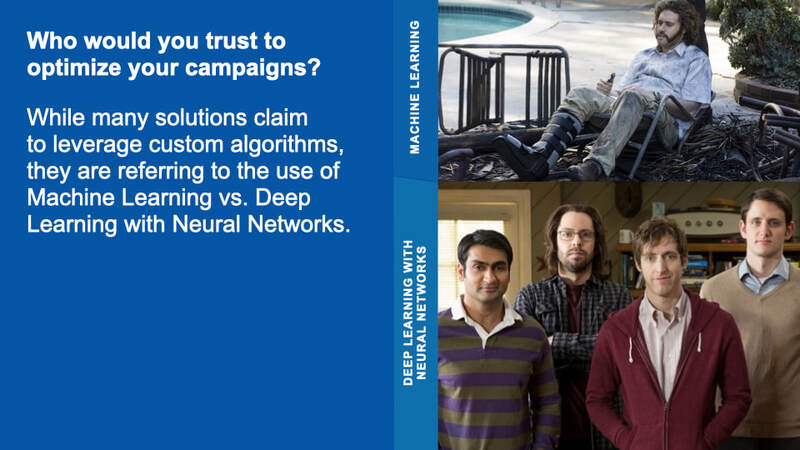
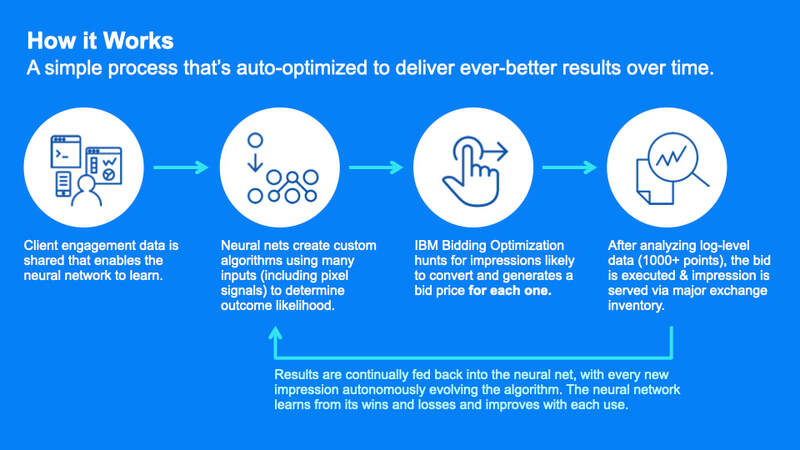
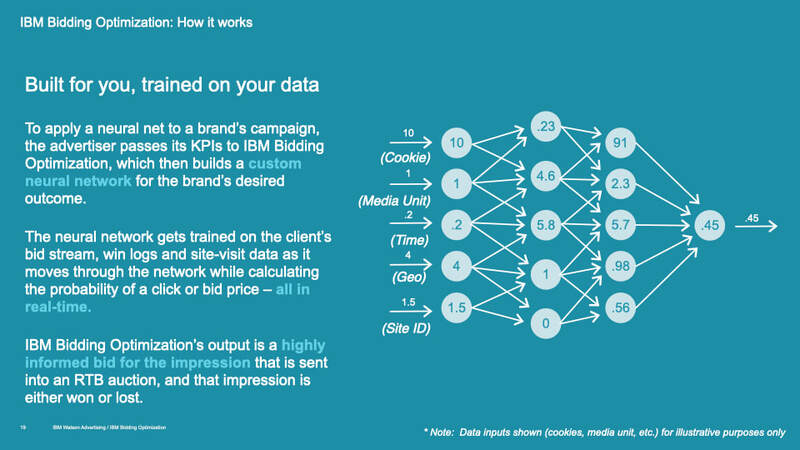
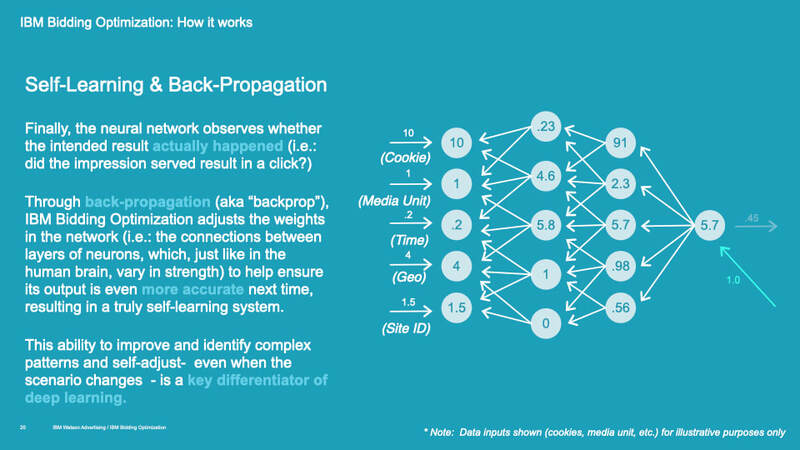
Bidding Optimization
Presentation - 2019
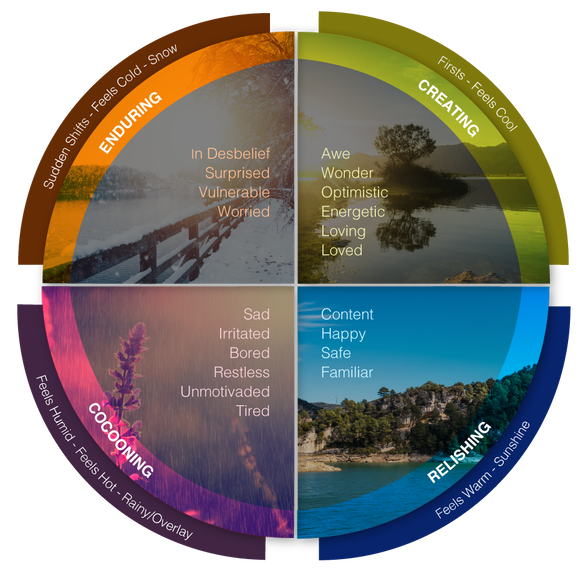
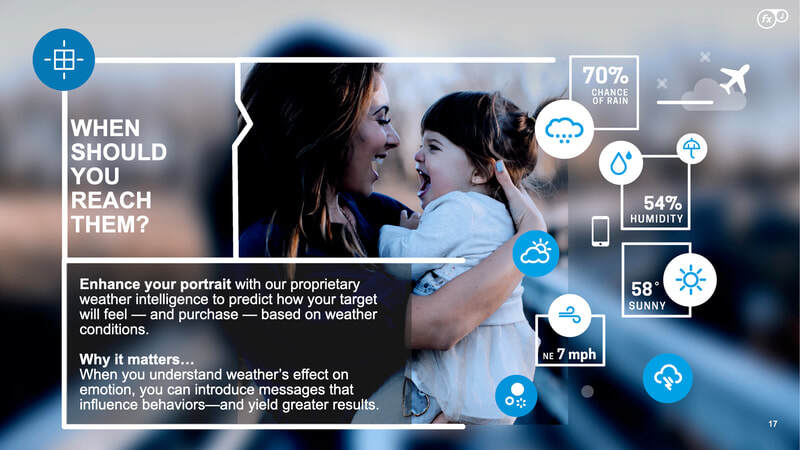
Weather and The Consumer Midset
Graphic - 2020
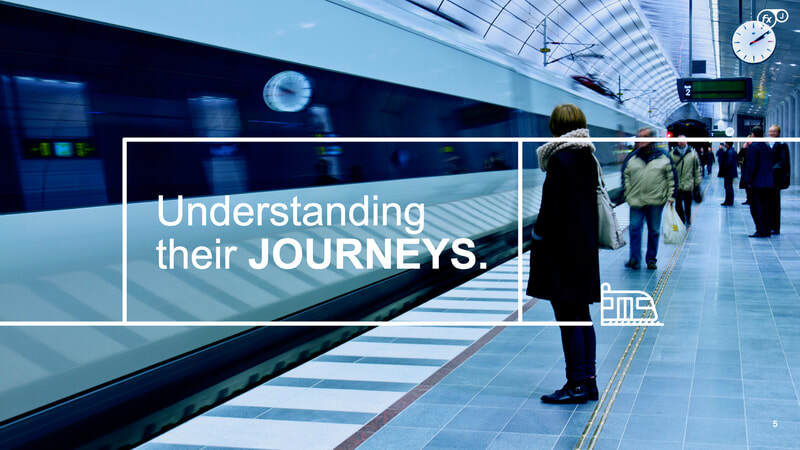
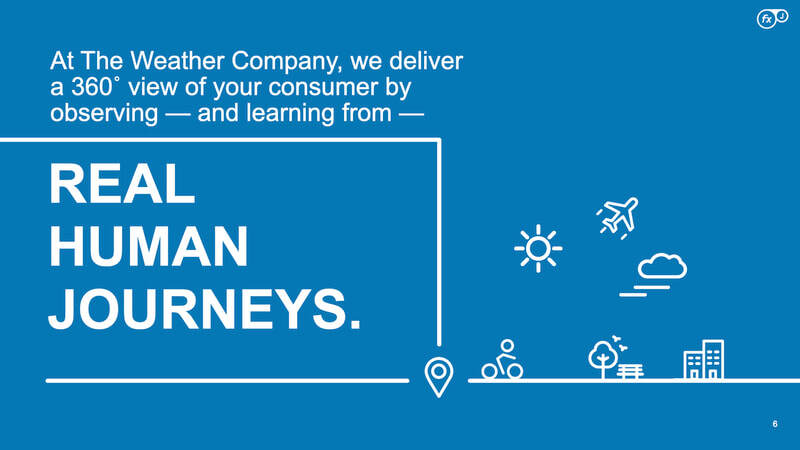
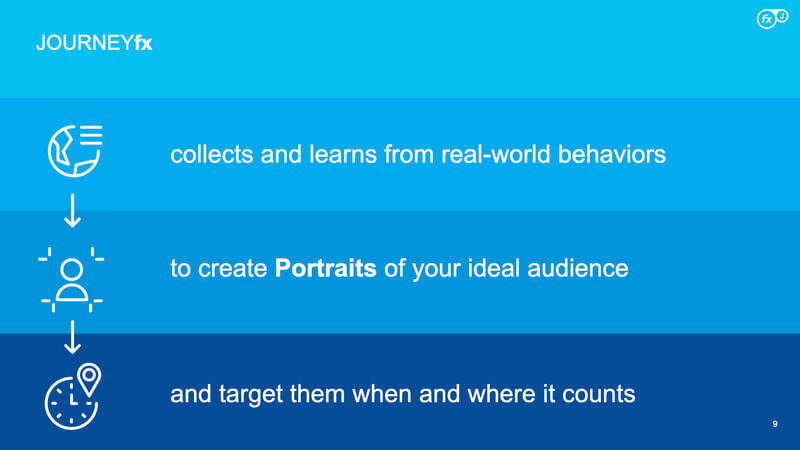
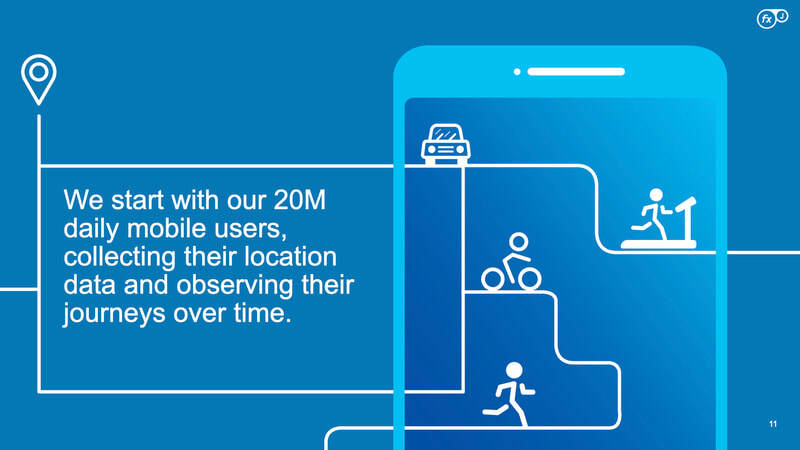
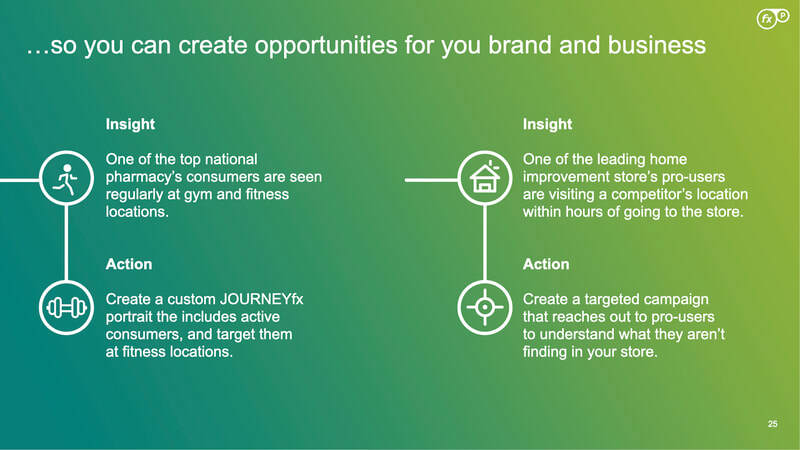
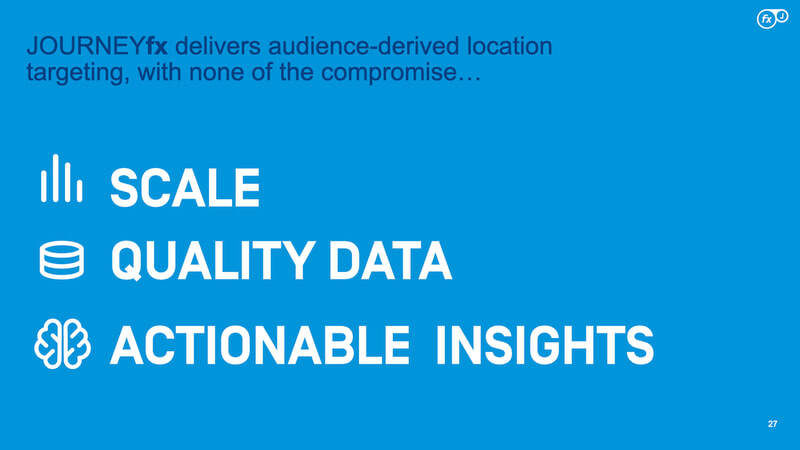
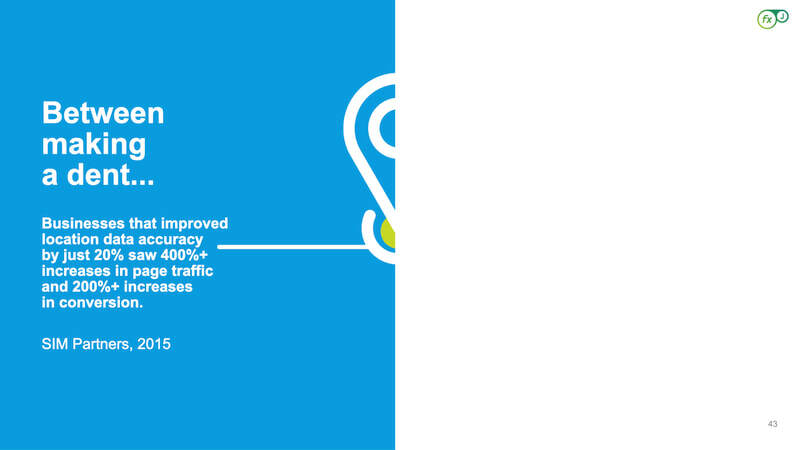
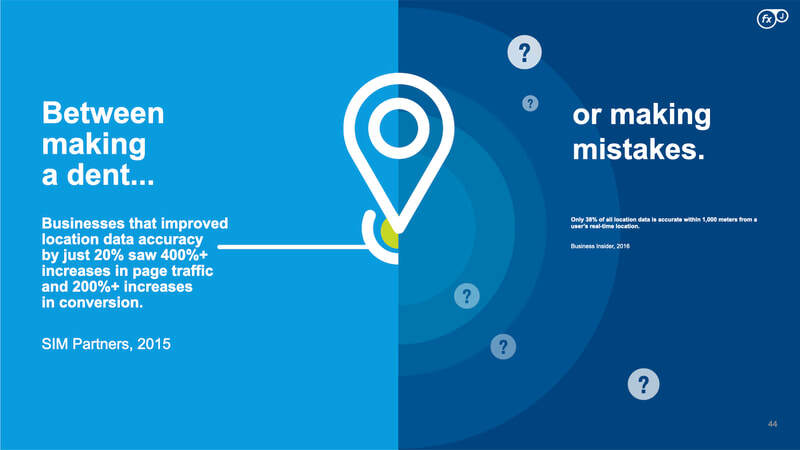
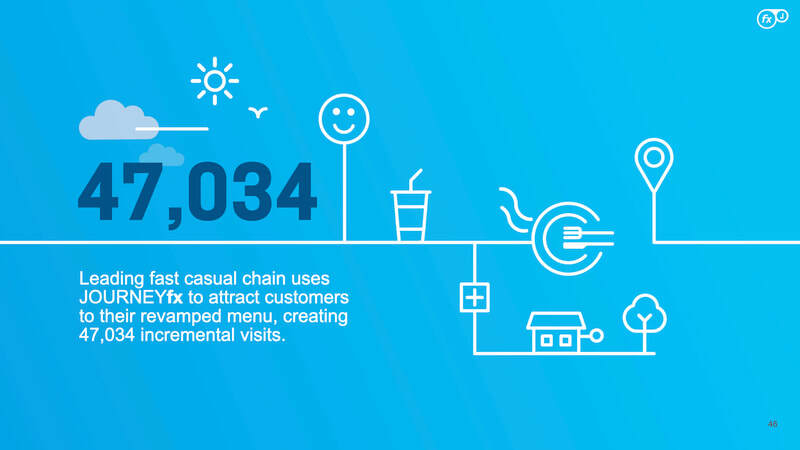
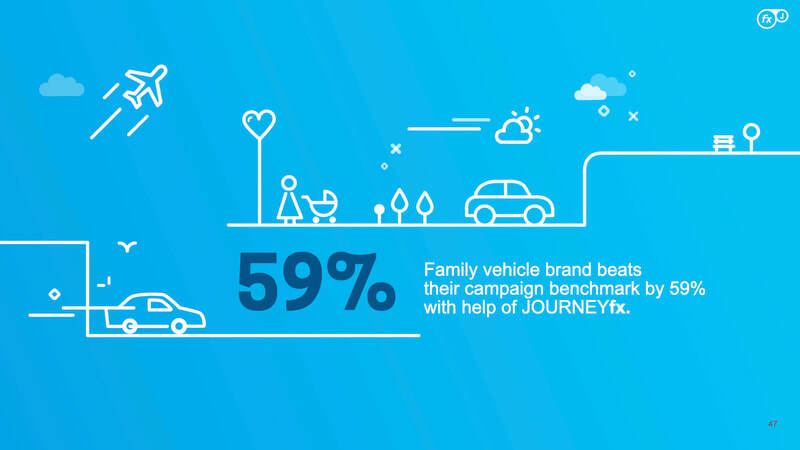
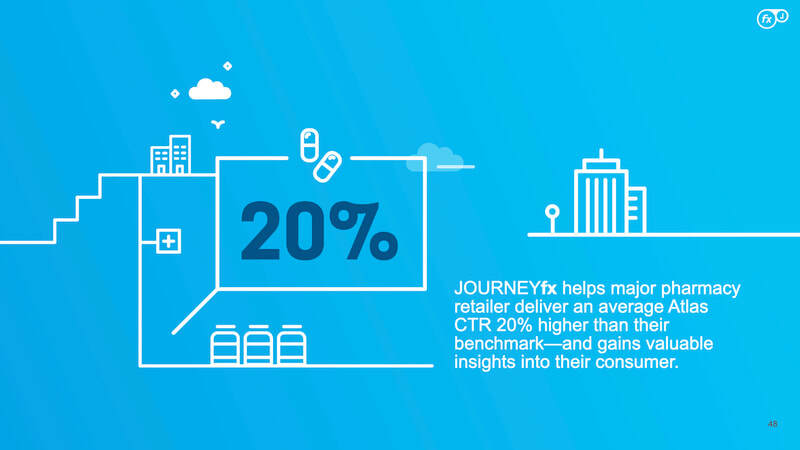
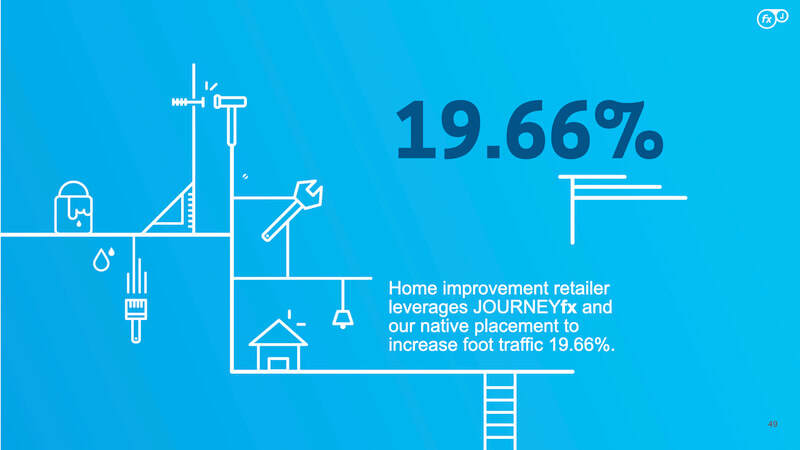
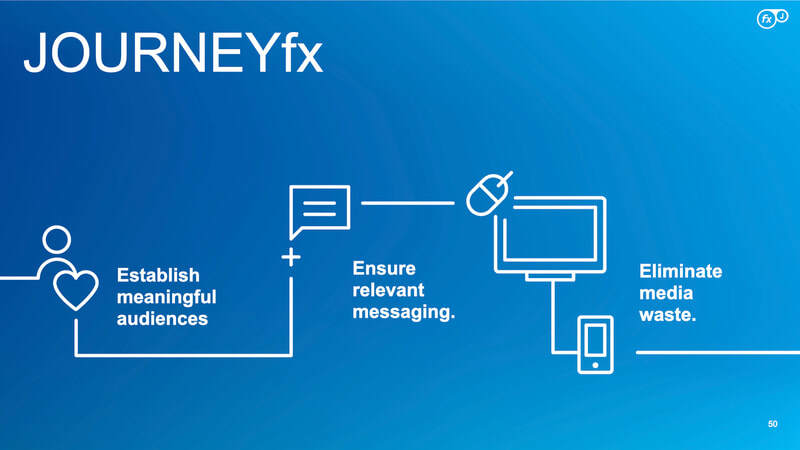
JourneyFX
Presentation - Graphics - 2016


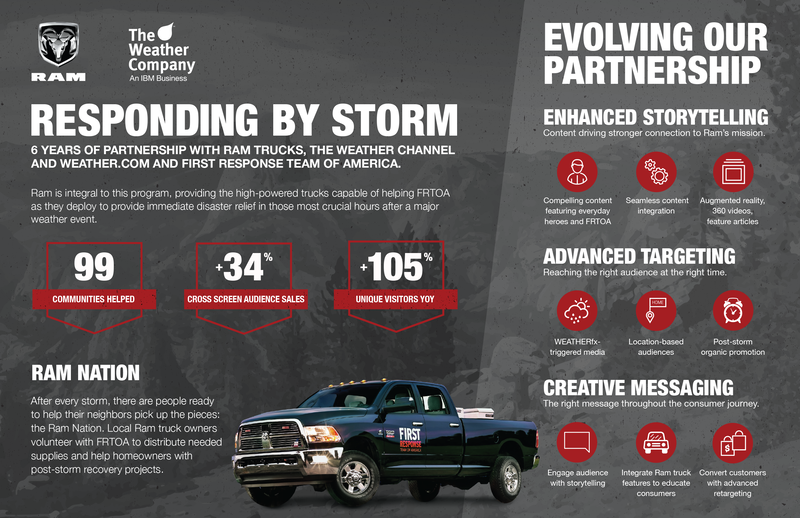
Post Campaign Insights
Single Pages - Graphics
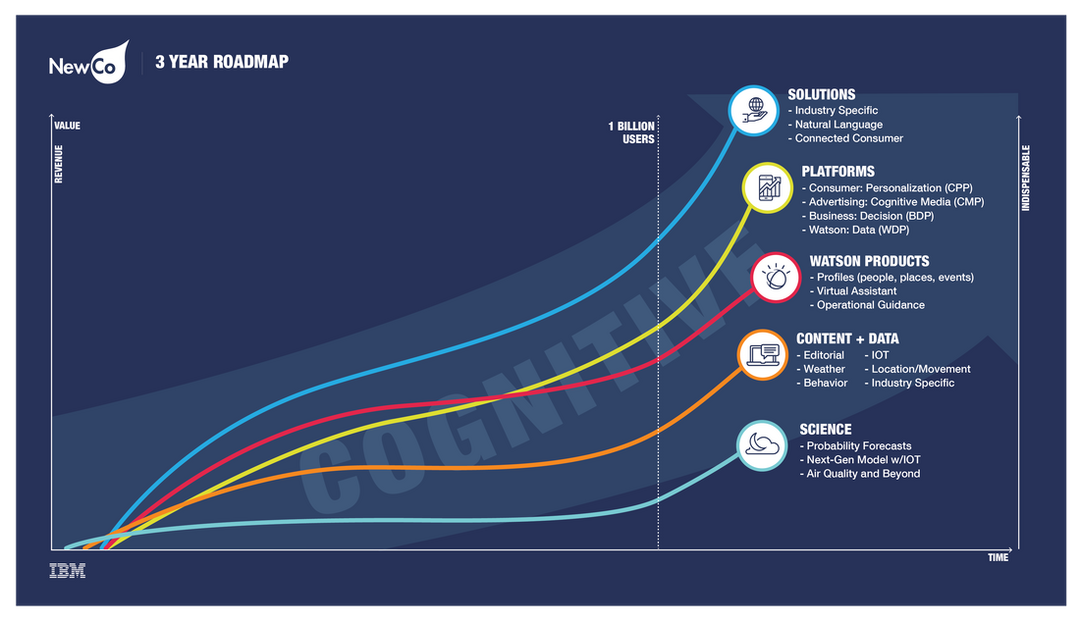
Company 3 Year Roadmap
Graphic - 2018
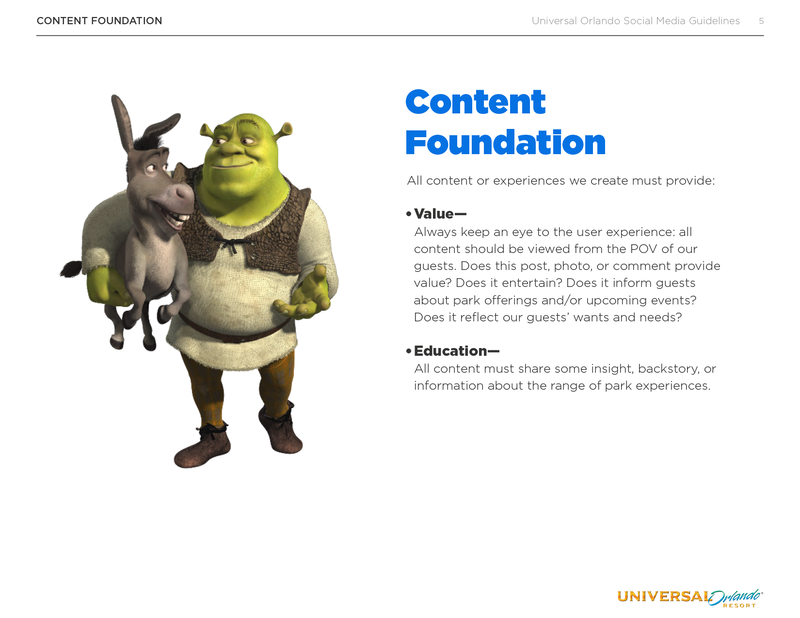
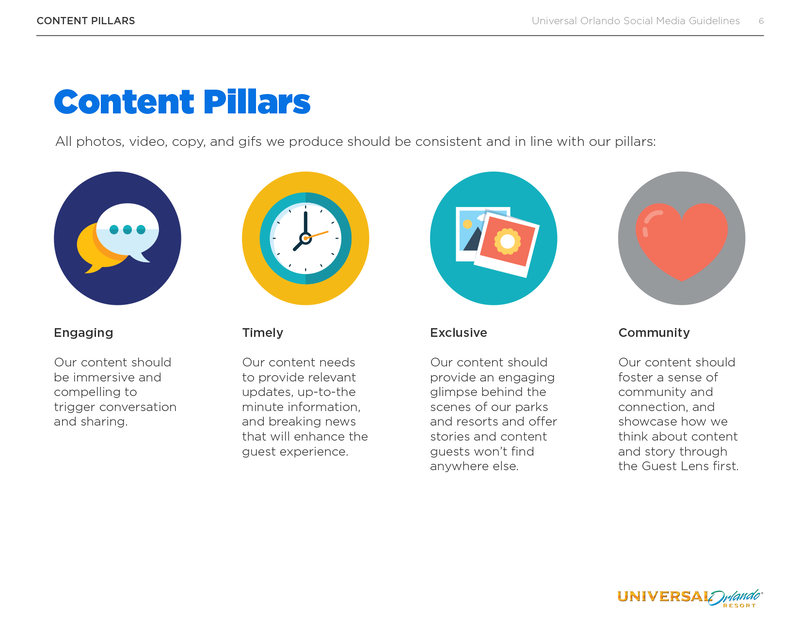
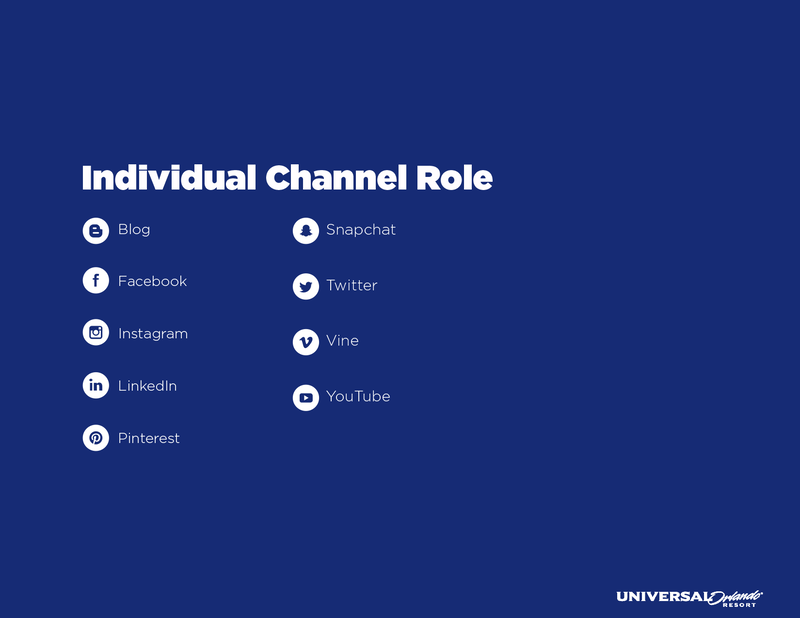
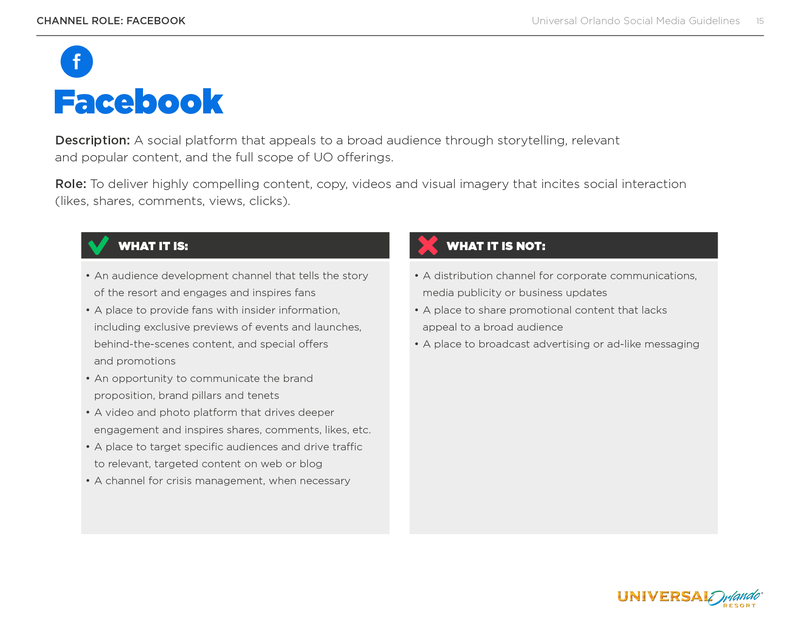
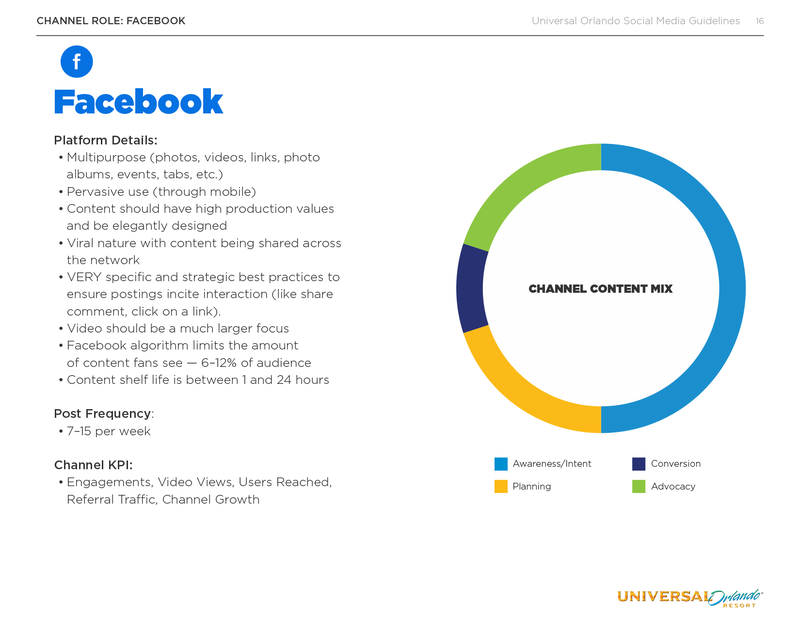
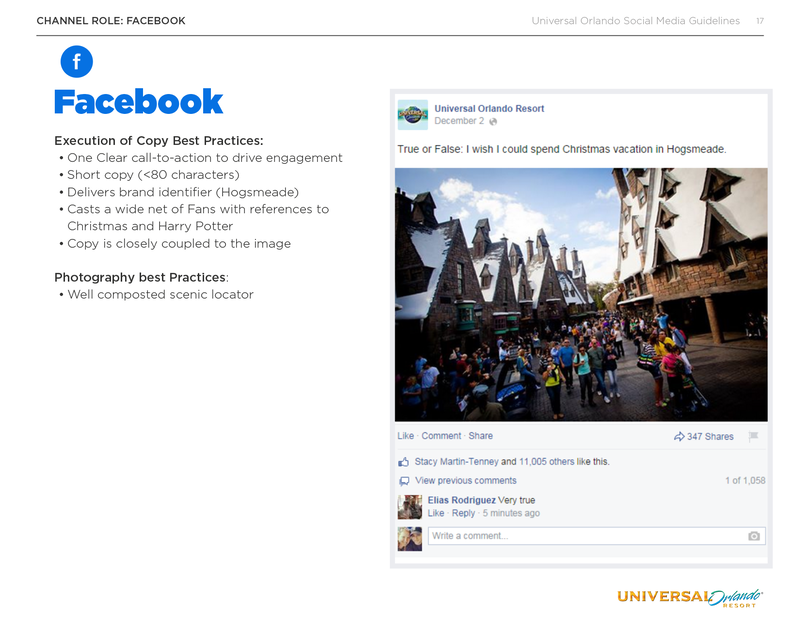
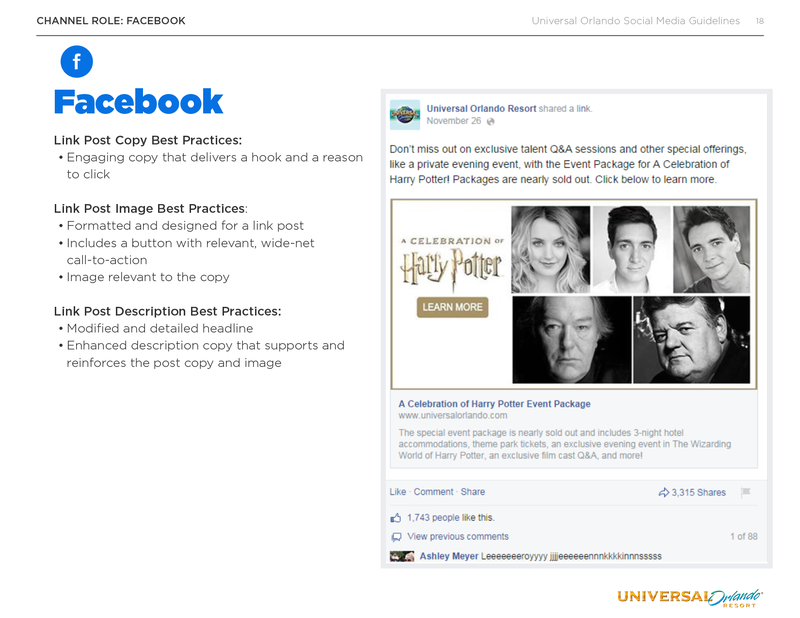
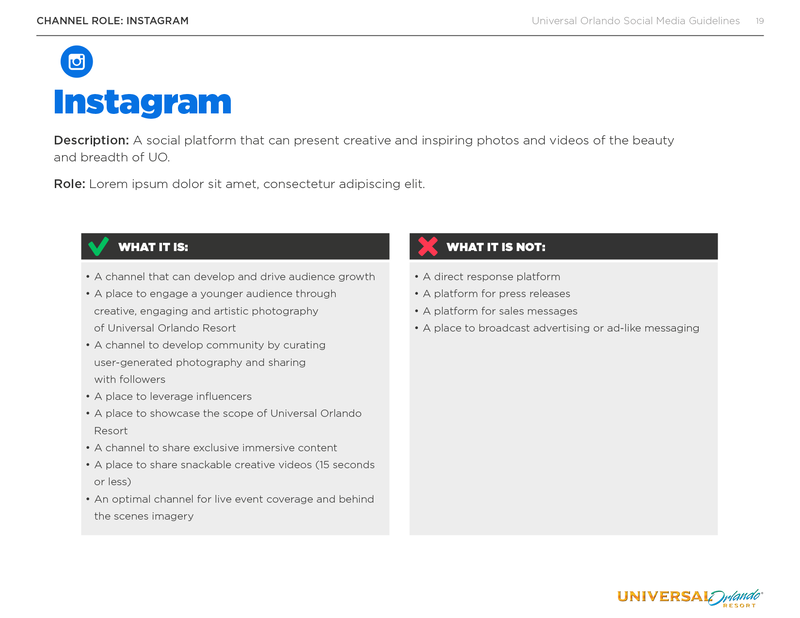
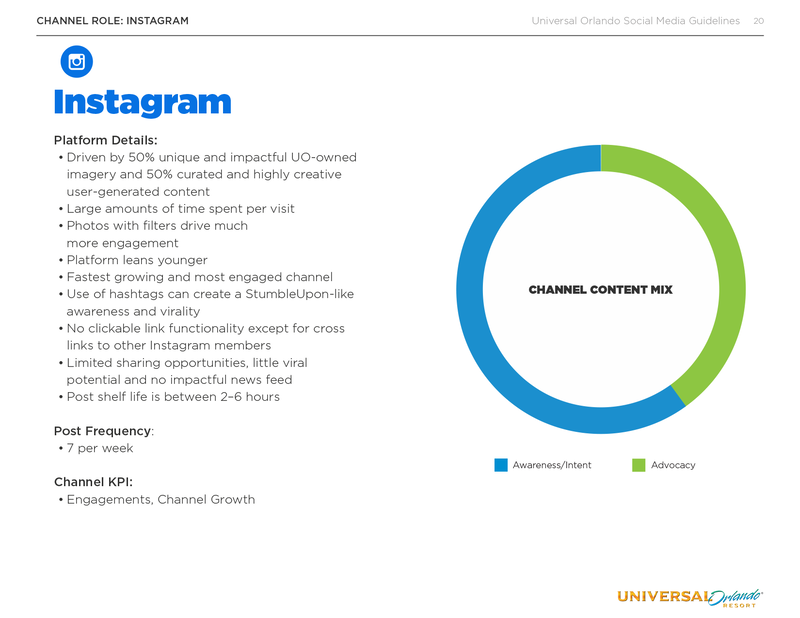
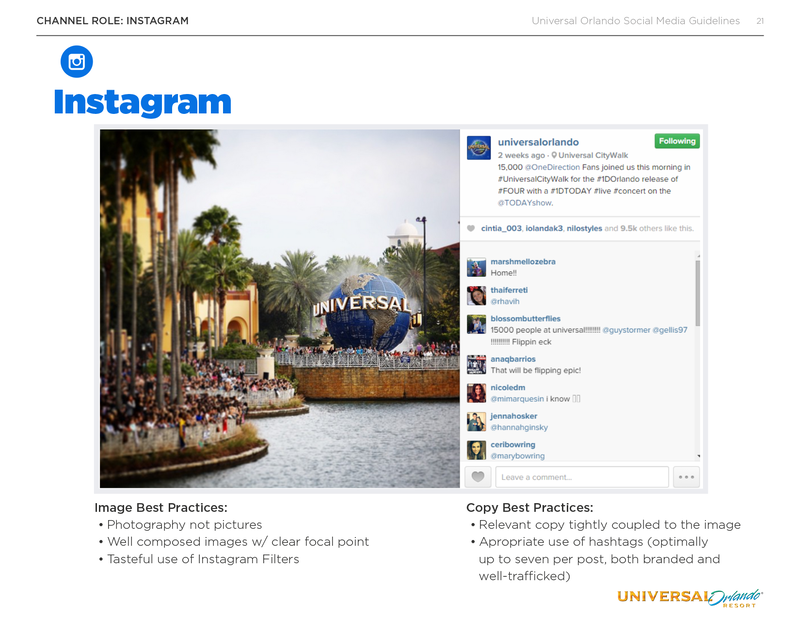
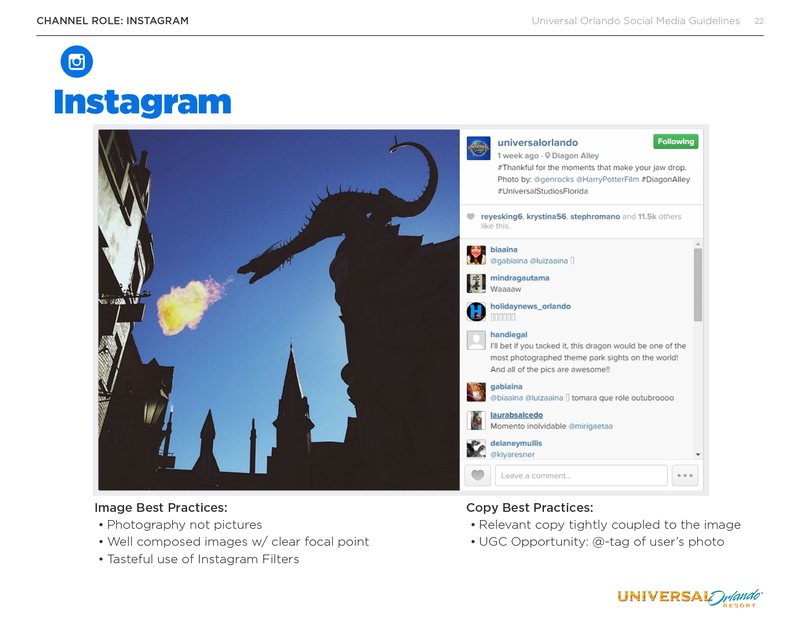
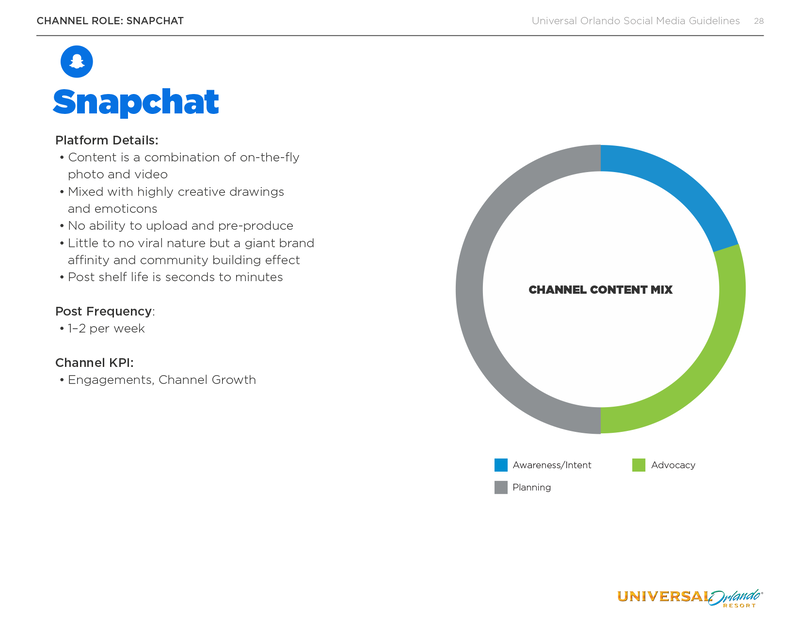
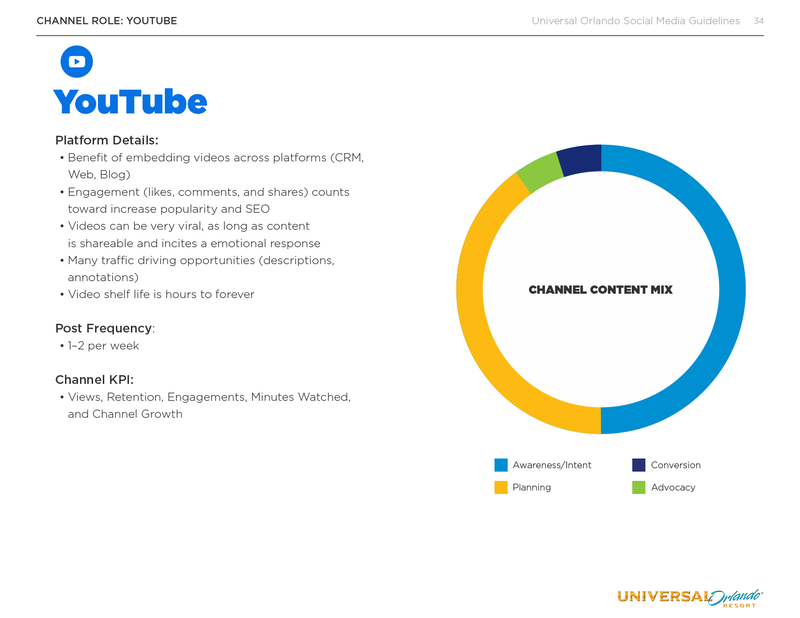
Universal Orlando Social Media Guidelines
Guideline - Internal Use - 2015